Key takeaways
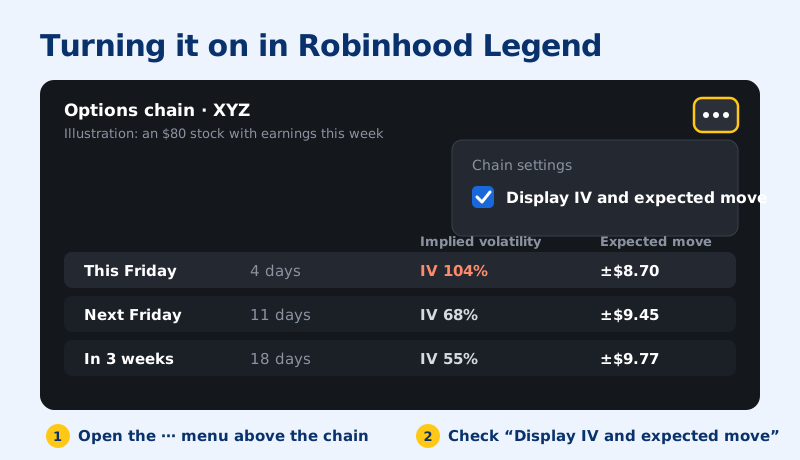
- In Robinhood Legend, open the ⋯ menu above the options chain and check “Display IV and expected move”.
- The expected move is how far the market thinks the stock could go, up or down, by that expiration.
- A spike in IV on one expiration usually means an event, most often earnings, falls in that week.
- High IV means higher premiums, but there's a reason the market expects a move. Check open interest too.
Before you start: read Vega Explained and Options Trading Terminology first.
If you trade options on Robinhood, there’s a feature in Robinhood Legend you’ll want to turn on. Right on the options chain, next to each expiration, you can now see two numbers: the implied volatility and the expected move.
It sounds small, but it changes how fast you can size up the risk of a trade. In this guide I’ll show you how to turn it on, what the two numbers mean, and how I read them, with three real examples: DocuSign right before earnings, Apple in a quiet period, and Nvidia just after earnings.
If you’re new to Robinhood Legend itself, it’s Robinhood’s desktop platform with proper charts and a fuller options chain. Everything below happens there.
How to turn on IV and expected move in Robinhood Legend
- Open Robinhood Legend and go to the options chain of any stock.
- Click the three-dot (⋯) menu in the top right, above the chain.
- Check Display IV and expected move.
That’s it. Each expiration on the chain now shows a percentage, the implied volatility for that expiration, and a number with a plus-or-minus sign, the expected move.
What IV and expected move mean
Implied volatility (IV) is how much movement the market is pricing into that stock’s options. The higher the IV, the more expensive the options, because buyers are paying for a bigger expected swing. I go deeper into how IV moves option prices in my guide to Vega.
Expected move turns that percentage into dollars. It tells you how far the market thinks the stock could move, up or down, by that expiration. It roughly covers one standard deviation, which means the stock finishes inside that range about two times out of three, and outside it about one time in three.
Brokers calculate it slightly differently, but a good rule of thumb is:
Expected move ≈ stock price × IV × √(days to expiration ÷ 365)
Here’s what that looks like for a $100 stock with 40% IV and 30 days to go:
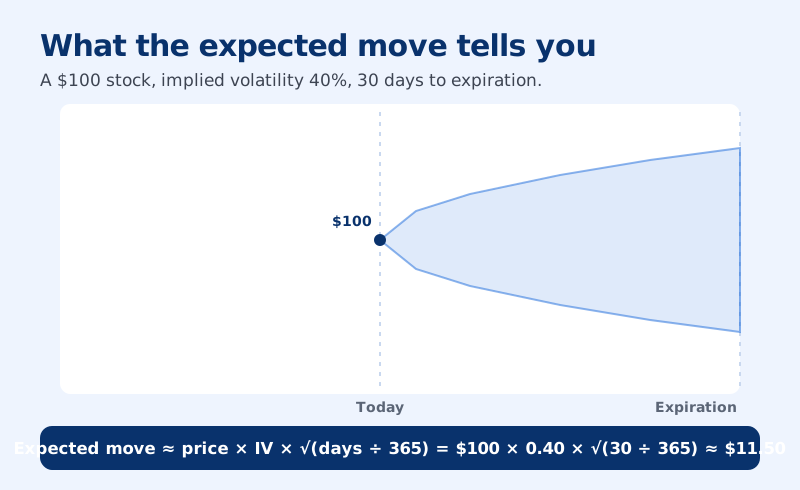
If you sell cash-secured puts, this is very handy. A strike outside the expected move, like the 85 put in that example, gives you a cushion the market itself considers less likely to be hit. It’s not a guarantee, about one time in three the stock does go further, but it’s a much better starting point than guessing.
Example 1: DocuSign right before earnings
Let’s use a real one. When I recorded the video in late August 2025, DocuSign (DOCU) had earnings coming on September 4. Imagine you were planning to sell a cash-secured put on it for the September 5 expiration.
With the new setting on, the problem jumps out immediately: the IV for that week was over 100%, while the following weeks were much lower, roughly in the 30–50% range.
Why the spike? Because earnings fell inside that expiration, and the market expected a big move. The expected move for that week gave you the dollar version of the same warning.
Without this view, you might only see a juicy premium and miss the fact that the market was pricing in far more risk that week. With it, you can decide on purpose: either avoid the earnings week and sell the next expiration, or take advantage of the high premium with a strike outside the expected move, knowing exactly what you’re signing up for.
Example 2: Apple in a quiet period
Now compare that to Apple (AAPL). Apple had just reported earnings and had no big news coming up. Its IV stayed flat at about 25–26%, week after week, and its expected move was much smaller and steady.
Options traders call this a quiet period: there’s no event being priced into the options.
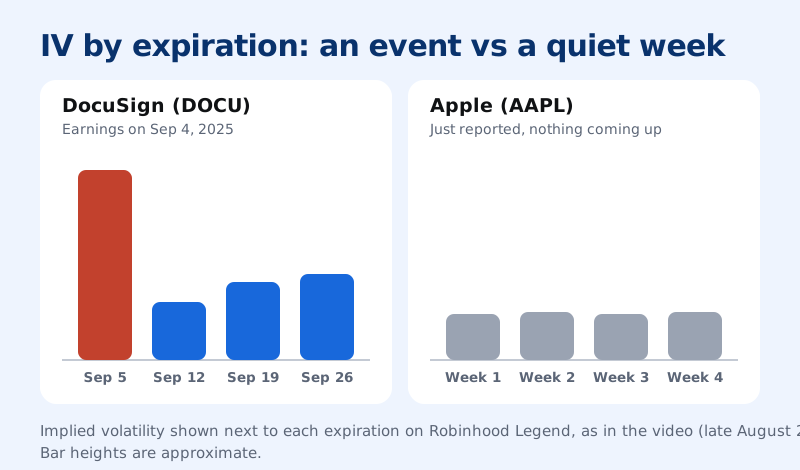
Put side by side, it’s easy to see which stock has an event coming and which doesn’t, without opening a single earnings calendar.
Example 3: Nvidia after earnings and the IV crush
Nvidia (NVDA) is known for big moves around earnings and AI announcements, so its IV pops ahead of those events and the expected move gets bigger.
When I recorded the video, Nvidia had reported a couple of weeks earlier, and its IV had already dropped back down. That’s the pattern you’ll see on almost every stock with a big event: IV climbs into it and falls sharply right after. That drop is called IV crush.
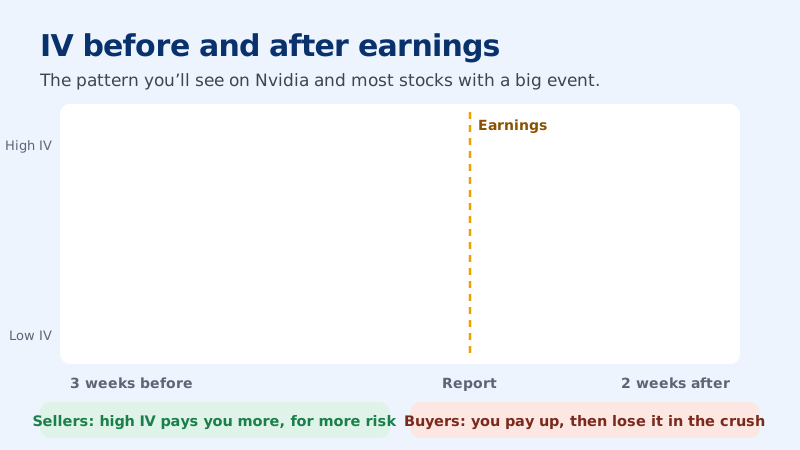
This matters on both sides of a trade:
- If you sell options, the high IV before an event pays you more, but you’re taking the event risk.
- If you buy options ahead of an event, you pay that high IV. Even if you’re right about the direction, the crush after the report can take a big bite out of your option’s value.
By comparing stocks this way, you can quickly see which earnings are coming up in the next few weeks and which stocks have already had theirs. I explain how traders play the crush in IV crush and Vega.
Bonus: check open interest too
One more number belongs next to IV and expected move: open interest. It tells you how many option contracts are open at a given strike and expiration.
Stocks like Apple and Nvidia usually have huge open interest, often tens of thousands of contracts per strike. That means lots of liquidity, tight bid-ask spreads, and easy entries and exits.
DocuSign tends to have much less. Fills can be slower and spreads wider, which quietly eats into the premium you collect. So check open interest alongside IV and expected move before you trade. I cover this in more detail in how to pick stocks for the wheel.
How I use it before a trade
- Scan the IV column first. If one expiration’s IV is far above the others, find out why before you trade it. It’s usually earnings.
- Decide on the event on purpose. Skip the event week, or trade it with eyes open and a strike outside the expected move.
- Use the expected move to place strikes. For a cash-secured put, I like a strike at or below the lower edge of the expected move. The same idea works for covered calls above the upper edge.
- Check open interest. High IV on a thinly traded stock means wide spreads on top of the event risk.
And remember: high IV means higher premiums, but the market is expecting a move for a reason. This feature doesn’t remove that risk. It just puts it right in front of you, so you’re making an informed decision instead of guessing. If you want to place the trade itself, my walkthrough on selling cash-secured puts on Robinhood goes step by step.
If you have questions about this feature, or anything else about options, leave a comment on the video. I read all of them and reply.
FAQ
How do I see the expected move on Robinhood?
In Robinhood Legend, open the options chain, click the three-dot (⋯) menu in the top right above the chain, and check “Display IV and expected move”. Each expiration then shows its implied volatility as a percentage and the expected move as a plus-or-minus dollar amount.What does the expected move mean in options?
It's the size of the move, up or down, that option prices imply for a stock by a given expiration. It roughly covers one standard deviation, so the stock finishes inside that range about two times out of three and outside it about one time in three.How is the expected move calculated?
Brokers differ slightly, and many use the price of the at-the-money straddle. A good rule of thumb is stock price × implied volatility × the square root of (days to expiration ÷ 365). A $100 stock with 40% IV and 30 days to go has an expected move of about $11.50.Why is implied volatility so high before earnings?
Because the market expects a big move when the company reports, so options for that week cost more. Right after the report, IV usually drops sharply. That drop is called IV crush, and it makes option premiums fall even if the stock barely moves.Check your understanding
Written by Abhi
I'm Abhi. I've invested in US stocks for years, and for the last five to six years options have been at the heart of how I trade. I started AD Finance to break complex options concepts into plain-English guides, so you can trade with confidence, and I built OptionsVault to track my own trades.
This guide is for education only and is not financial advice. Options trading involves risk. Read the full disclaimer.